
Understanding Carrier Coverage Maps: How to Read Them and Why They're Imperfect

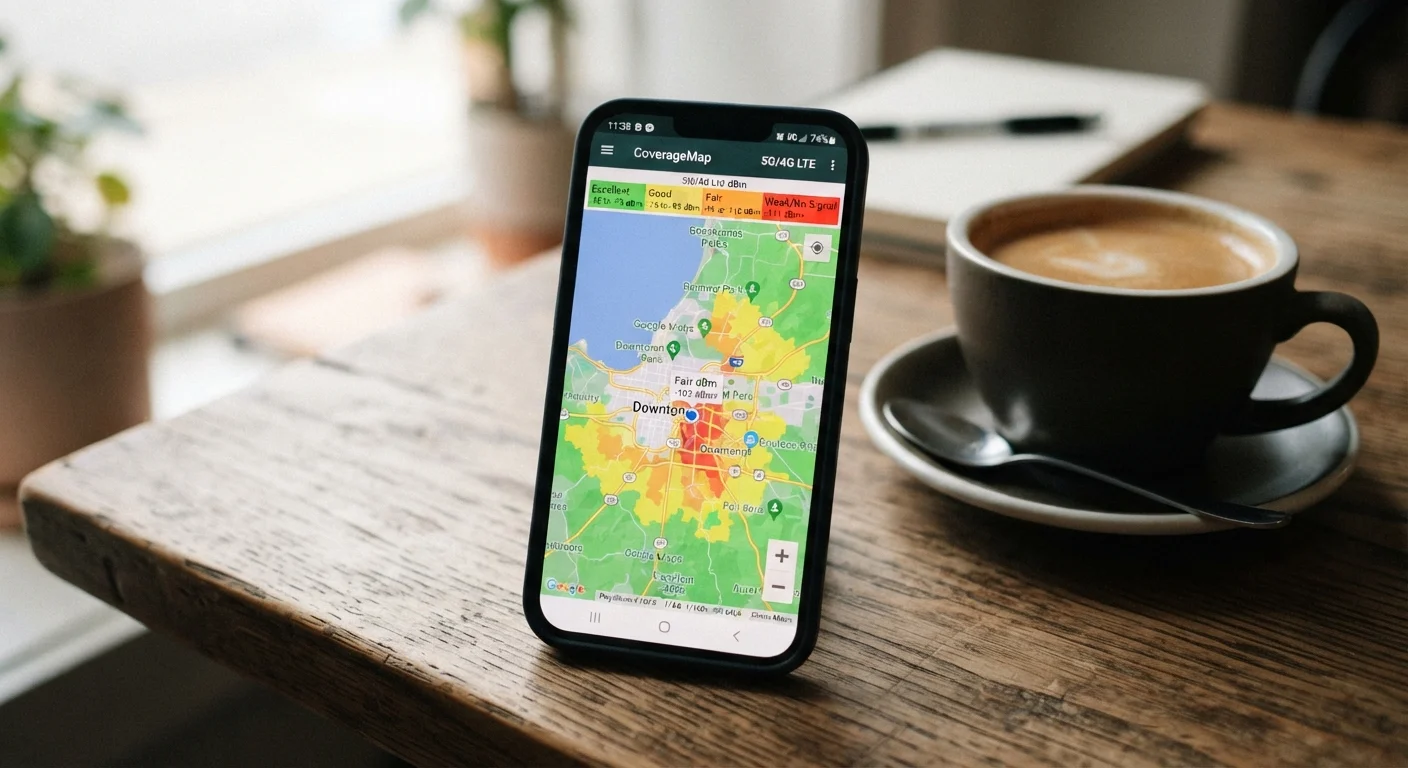
Photo: ScoutAnswers.com | Blogs That Ignite Curiosity editorial
Key Takeaways
- Coverage maps show predicted signal, not guaranteed real-world performance at any specific location.
- Outdoor signal estimates don't account for building materials, terrain, or dense urban interference.
- Third-party tools and crowd-sourced data often give a more accurate picture than official carrier maps.
- Testing a network with a trial period or returnable device is the most reliable verification method.
- Map color coding varies by carrier, so comparing maps side-by-side requires understanding each carrier's legend.
What Coverage Maps Actually Measure
Carrier coverage maps are predictive models, not live measurements. Carriers use a combination of tower locations, antenna orientation data, terrain modeling, and propagation algorithms to estimate where a signal of a given strength is likely to reach. The result is a color-coded graphic that looks precise but represents a statistical approximation.
Most maps distinguish between voice coverage, standard LTE or 4G data, and newer 5G service - though the specific color coding and legend definitions vary by carrier. A shaded area on one carrier's map may represent a minimum signal threshold that differs from a competitor's definition of the same color. That inconsistency makes side-by-side visual comparisons unreliable without reading each legend carefully. For more on decoding the language carriers use, see this field guide to carrier terminology.
5G Coverage Maps Require Extra Scrutiny
Where Maps Tend to Overstate Reality
Coverage predictions assume an unobstructed outdoor environment at a standardized height. That assumption breaks down in several common situations:
- Buildings and interiors: Concrete, metal framing, and low-e glass can reduce signal strength dramatically. A location shown as covered outdoors may have poor or no usable signal indoors.
- Terrain and vegetation: Hills, valleys, dense foliage, and even heavy rainfall attenuate radio frequency signals in ways that flat-terrain models underestimate.
- Network congestion: Maps reflect signal availability, not speed or capacity. A technically covered area during a large event or in a dense urban corridor may deliver slow, frustrating data speeds due to congestion - not absent signal.
- Device differences: Older phones, budget handsets, and devices not fully compatible with a carrier's band portfolio may experience weaker coverage than the map assumes.
~30%
Signal loss entering typical buildings
Research in RF propagation consistently shows that indoor environments can reduce signal strength by 10 dB or more - roughly equivalent to a 30-50% reduction in usable signal compared to outdoor predictions.
3
Distinct 5G frequency bands in use
The FCC and industry groups recognize low-band, mid-band, and high-band (millimeter wave) 5G as distinct technologies, each with different range and speed characteristics often collapsed into a single map color.
How to Verify Signal Before You Commit
Rather than relying solely on official maps, use multiple verification methods before switching carriers or signing a contract.
Use crowd-sourced signal tools alongside official carrier maps.
Visit your most critical locations during a trial period with a temporary or returnable device.
Ask contacts who use the same carrier how service performs in your specific area.
Check whether the carrier's map distinguishes indoor from outdoor coverage.
Once you've evaluated coverage, review the full plan terms carefully. Our phone plan checklist covers the questions worth asking before committing to any carrier.
Quick Steps You Can Take Today
You don't need to wait for a billing cycle to end or a contract to expire to start gathering better signal information. Several actions deliver results immediately.
Understanding coverage is one piece of a broader evaluation. See what actually differentiates U.S. wireless carriers for context on network infrastructure, plan structures, and which audiences each carrier tends to serve. And if you're evaluating home broadband alongside mobile service, the Home Internet hub provides a grounding in service types and what to look for from an ISP.
The content on this site is for informational purposes only and is not a substitute for professional advice. Always consult a qualified professional for guidance specific to your situation.